
Data
Daytime Demo
Nighttime Demo
Testing Configuration
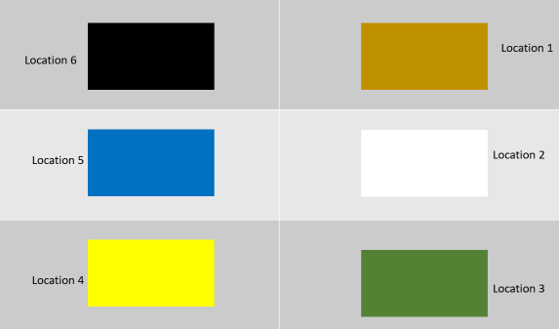
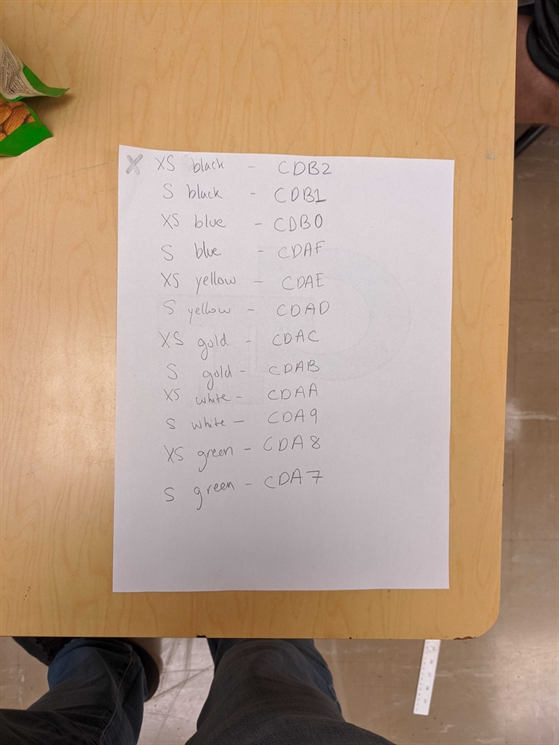
The test consisted of 6 individual lots consisting of two "assets," or boxes according to the colors depicted below. The robotic RFID scanner would line track around the lots(shown in the videos above), stop at barcode placed at the base of the lots, and perform a 10 second scan. The tags ids and associated colors are listed below as well.
Results Visualized
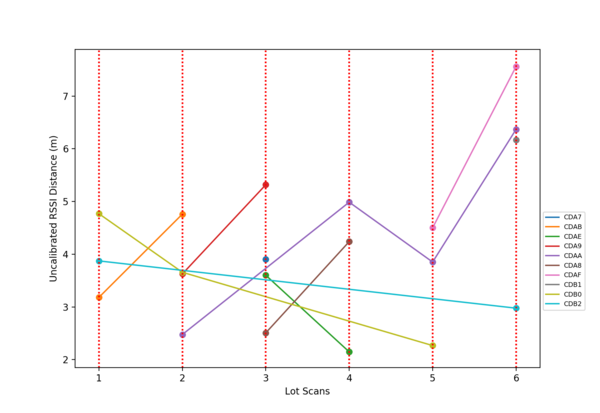
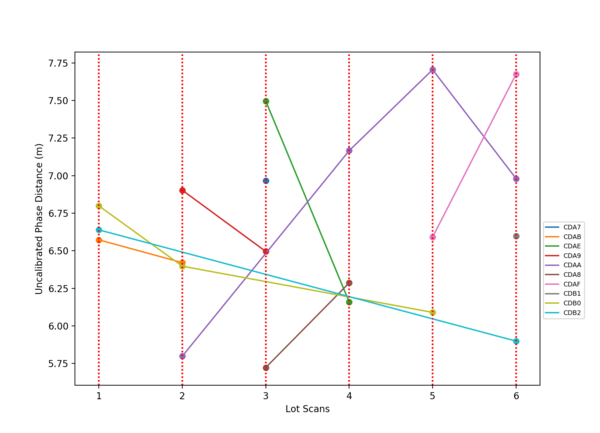
Each asset/box is predicted to be located at the lot where the distance is at its minimum. Based on the scans, the scanner predicted all of the tag locations correctly with the exception of the S yellow box.
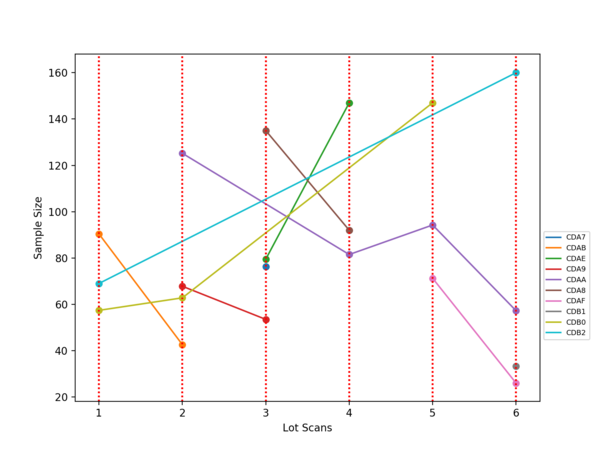
Tag Sample Size:
RSSI Distance vs. Lot:
 Phase Distance vs Lot:
Tag Sample Size:
RSSI Distance vs. Lot:
Phase Distance vs Lot:
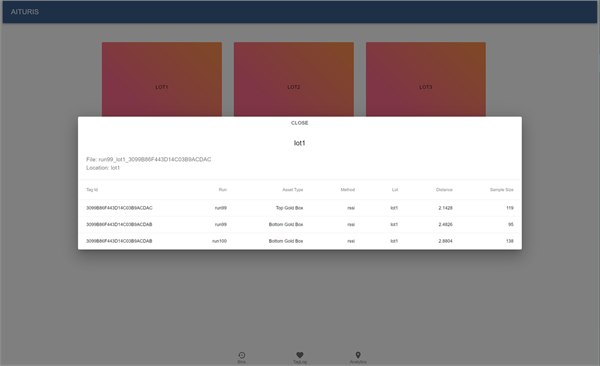
GUI Interface for Product
Specifications
Bandwidth: 865-928MHz
Transmit Power: +10-31.5dBm
Max Recieve: -84 dBm
Power Supply: 2Vdc/2.1A
Transmit Power: +10-31.5dBm
Max Recieve: -84 dBm
Power Supply: 2Vdc/2.1A